Diagnostic Operational Tool - PwC
PwC's Operations & Transformation team sought our assistance to improve their efficiency internally. This team advises external companies on optimising their entire operation lifecycles, focusing on areas such as supply chain, procurement, and management to enhance productivity and overall performance. We collaborated with the team to identify ways to reduce the time and effort required to produce insightful and valuable reports for their clients.
Client
PwC
DELIVERABLES
Wireframes Web Application
Year
2022
Role
UX Designer
02 VALUE PROPOSITION
Following our research, we facilitated an in-person workshop to define the core user segment and value proposition for the new internal opportunity-tracking tool.
For: Consulting teams across PwC
Who: need to manage client opportunities more effectively and reduce time spent on manual processes
Our product: is an internal business development tool
That: streamlines opportunity tracking, surfaces relevant insights, and reduces duplication and admin effort
03 BEHAVIORAL JOURNEY MAP
At this point in our PwC project, we created a behavioral journey map, a visual tool that outlined the end-to-end steps a consultant takes to identify, track, and act on a client opportunity. It included key actions, internal tool touchpoints, and common barriers across teams.
Starting Scenario: A consultant identifies a potential client opportunity and wants to log and develop it, but often encounters fragmented systems, lack of visibility across teams, and duplicated efforts.
Target Behavior: Proactive logging of opportunities, regular updates and collaboration across service lines, and strategic use of internal insights to guide decision-making.
Desired Outcome: Increased visibility of firm-wide opportunities, reduced duplication, faster progression of deals, and more consistent, data-informed business development.
This approach helped us map out how consultants currently engage with business development tasks and identify where the internal tool could simplify workflows, enhance collaboration, and support PwC’s growth objectives.
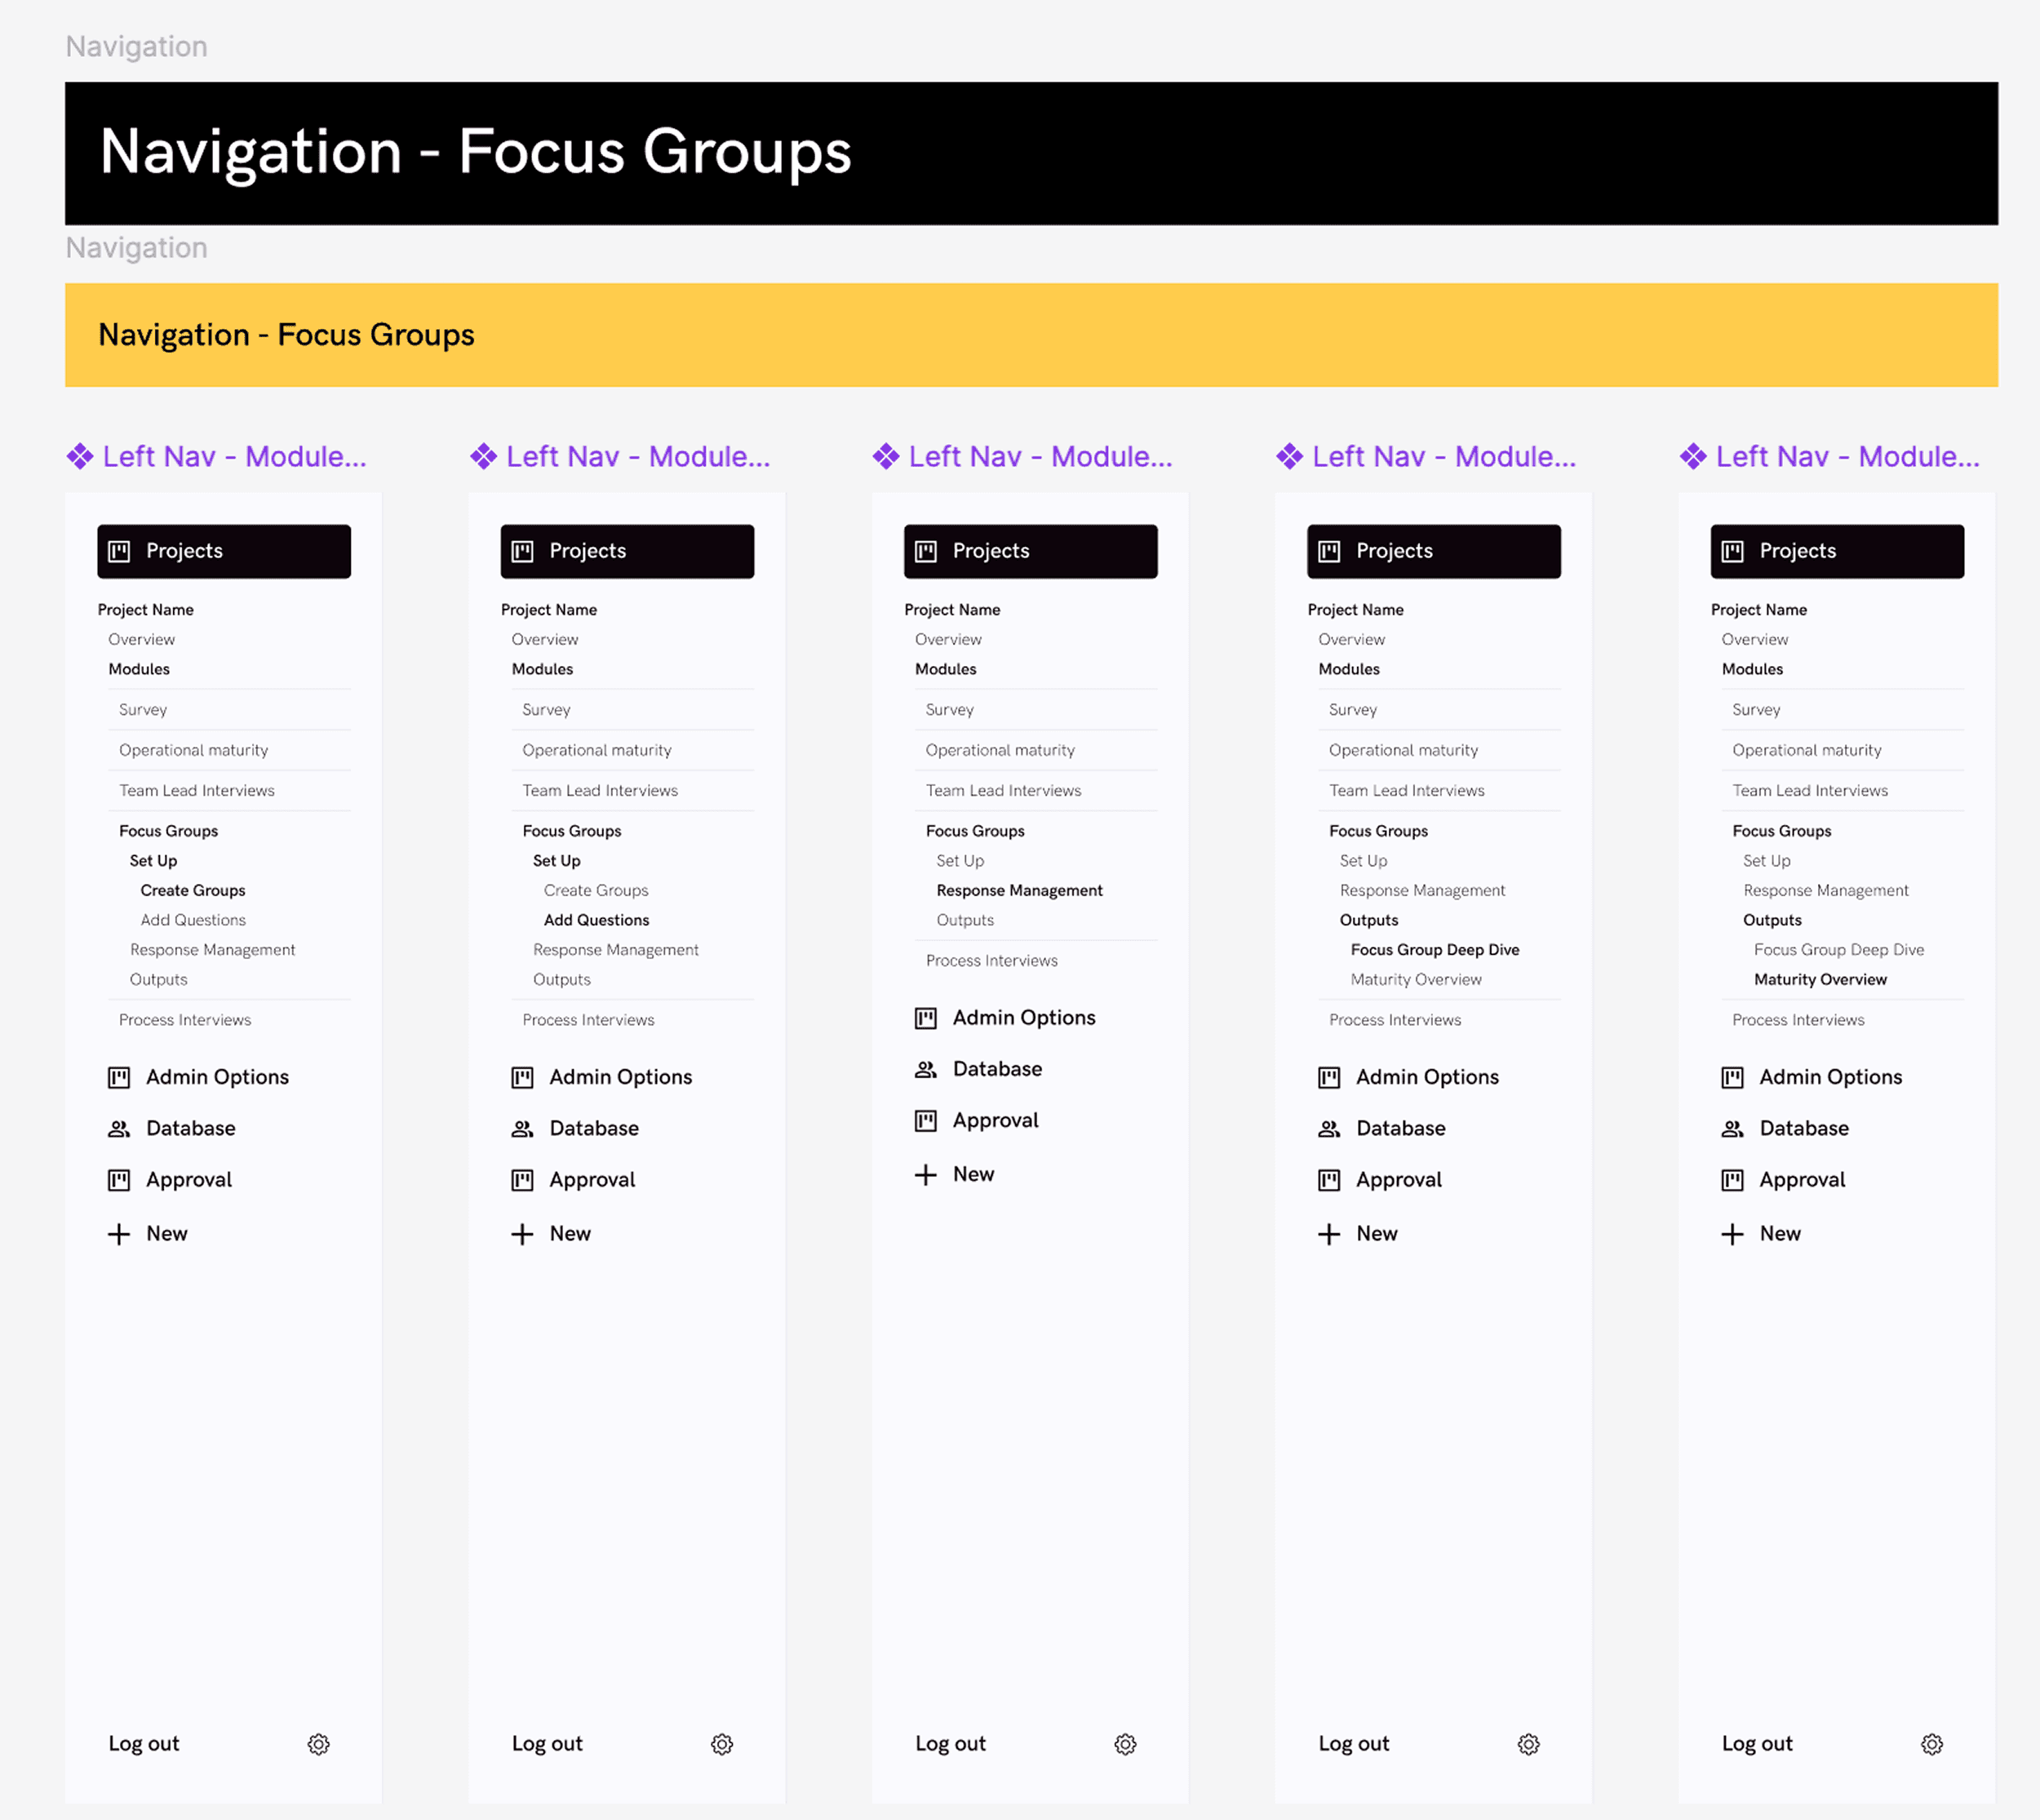
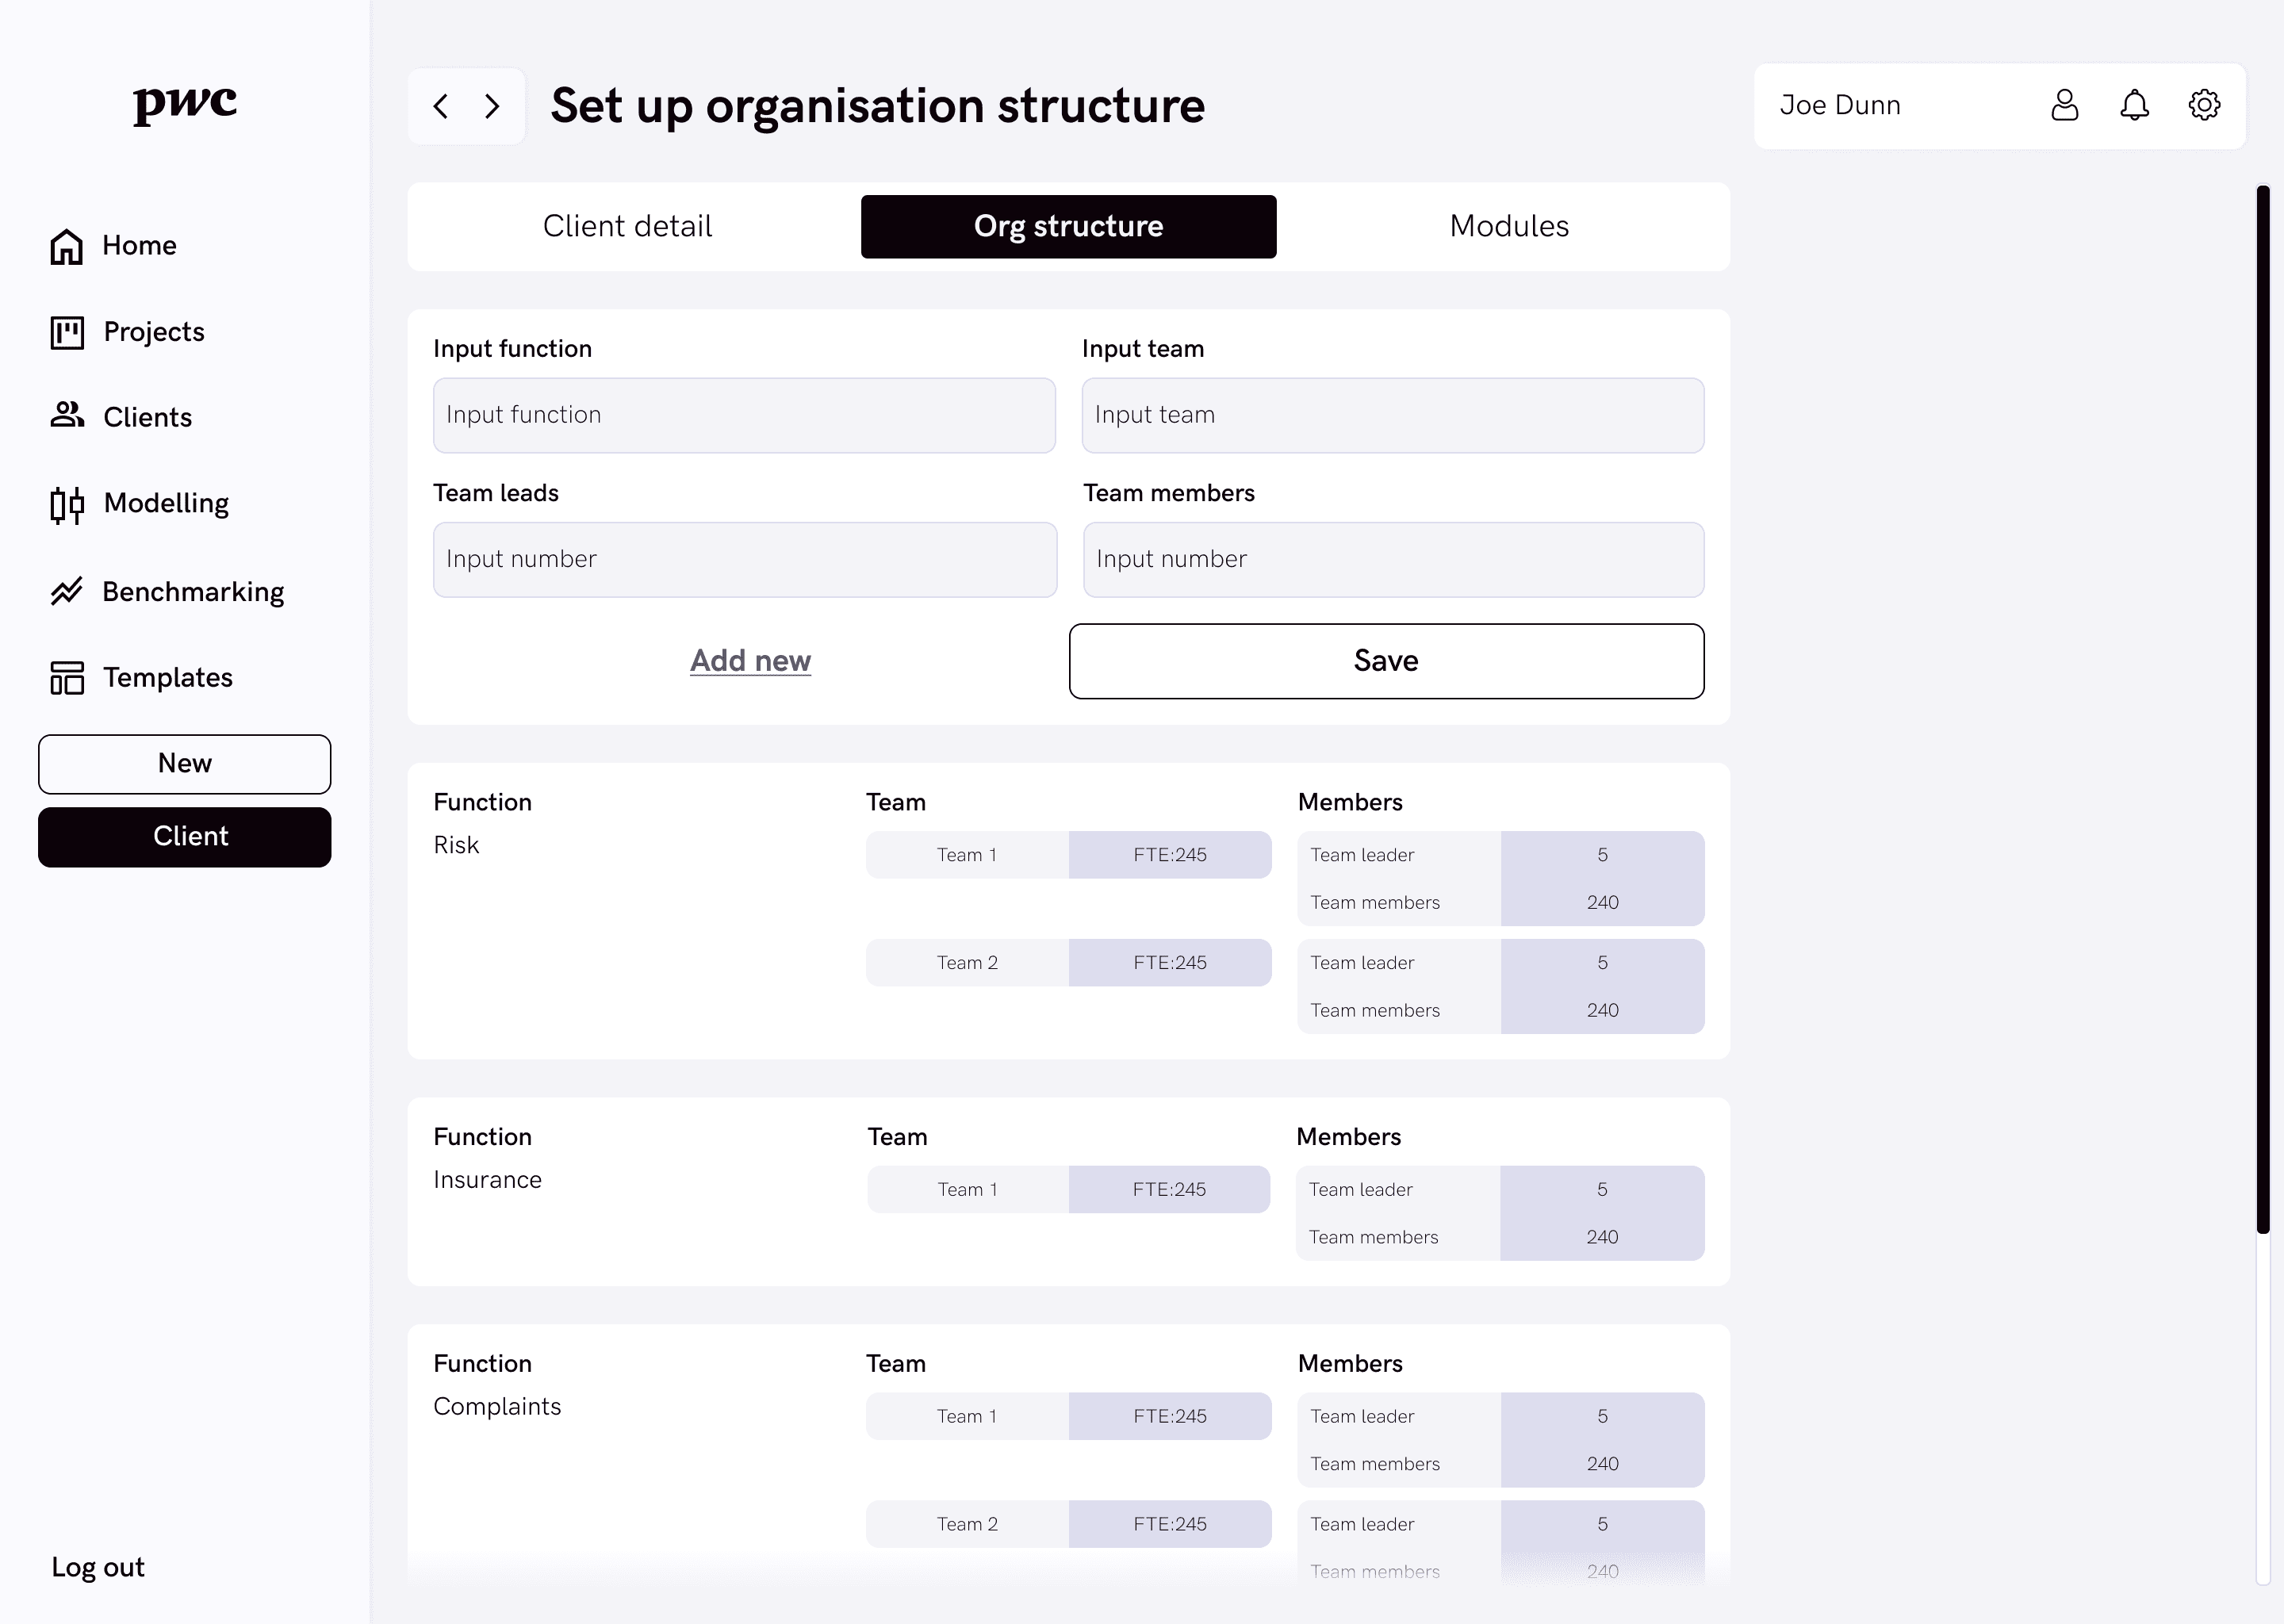
04 DESIGN
My goal was to craft a visual language that reflected the professionalism of the firm, made business development feel intuitive, and supported seamless collaboration across teams, turning a traditionally manual process into something focused, efficient, and easy to use.
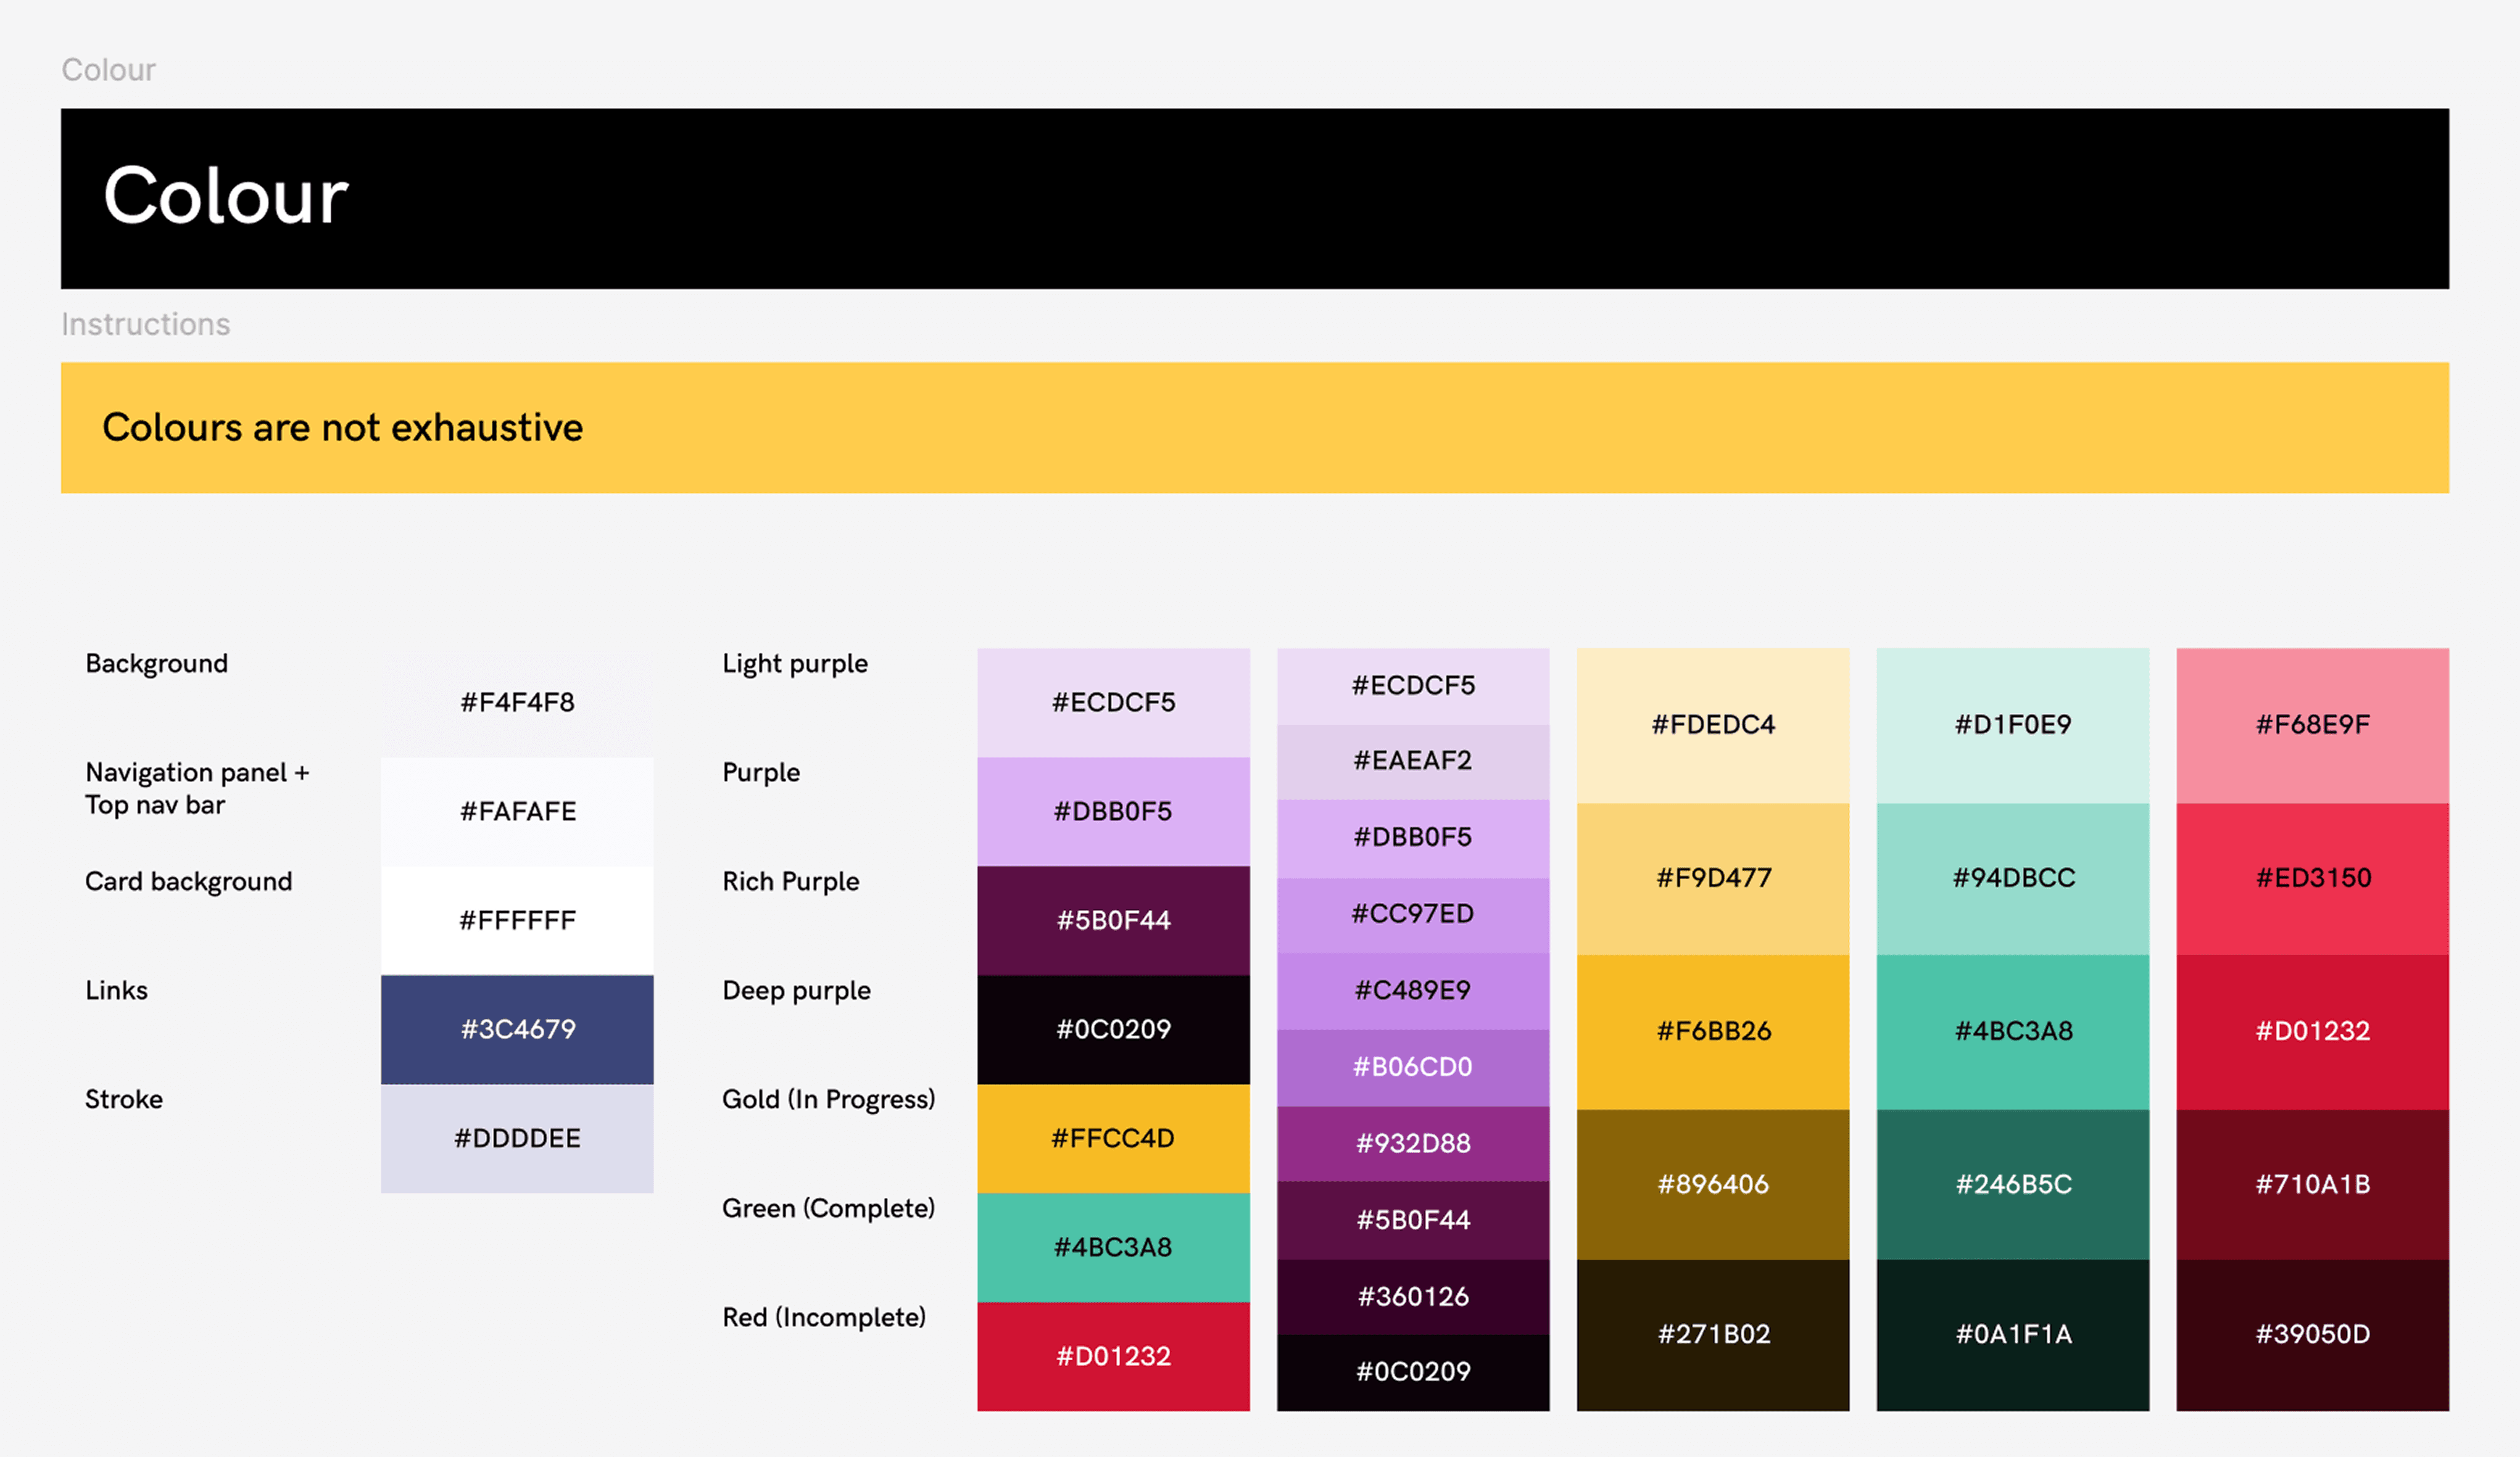
05 BRANDING
We followed the organisation's style guide for colour and typography, but created our own system for components (shown below).
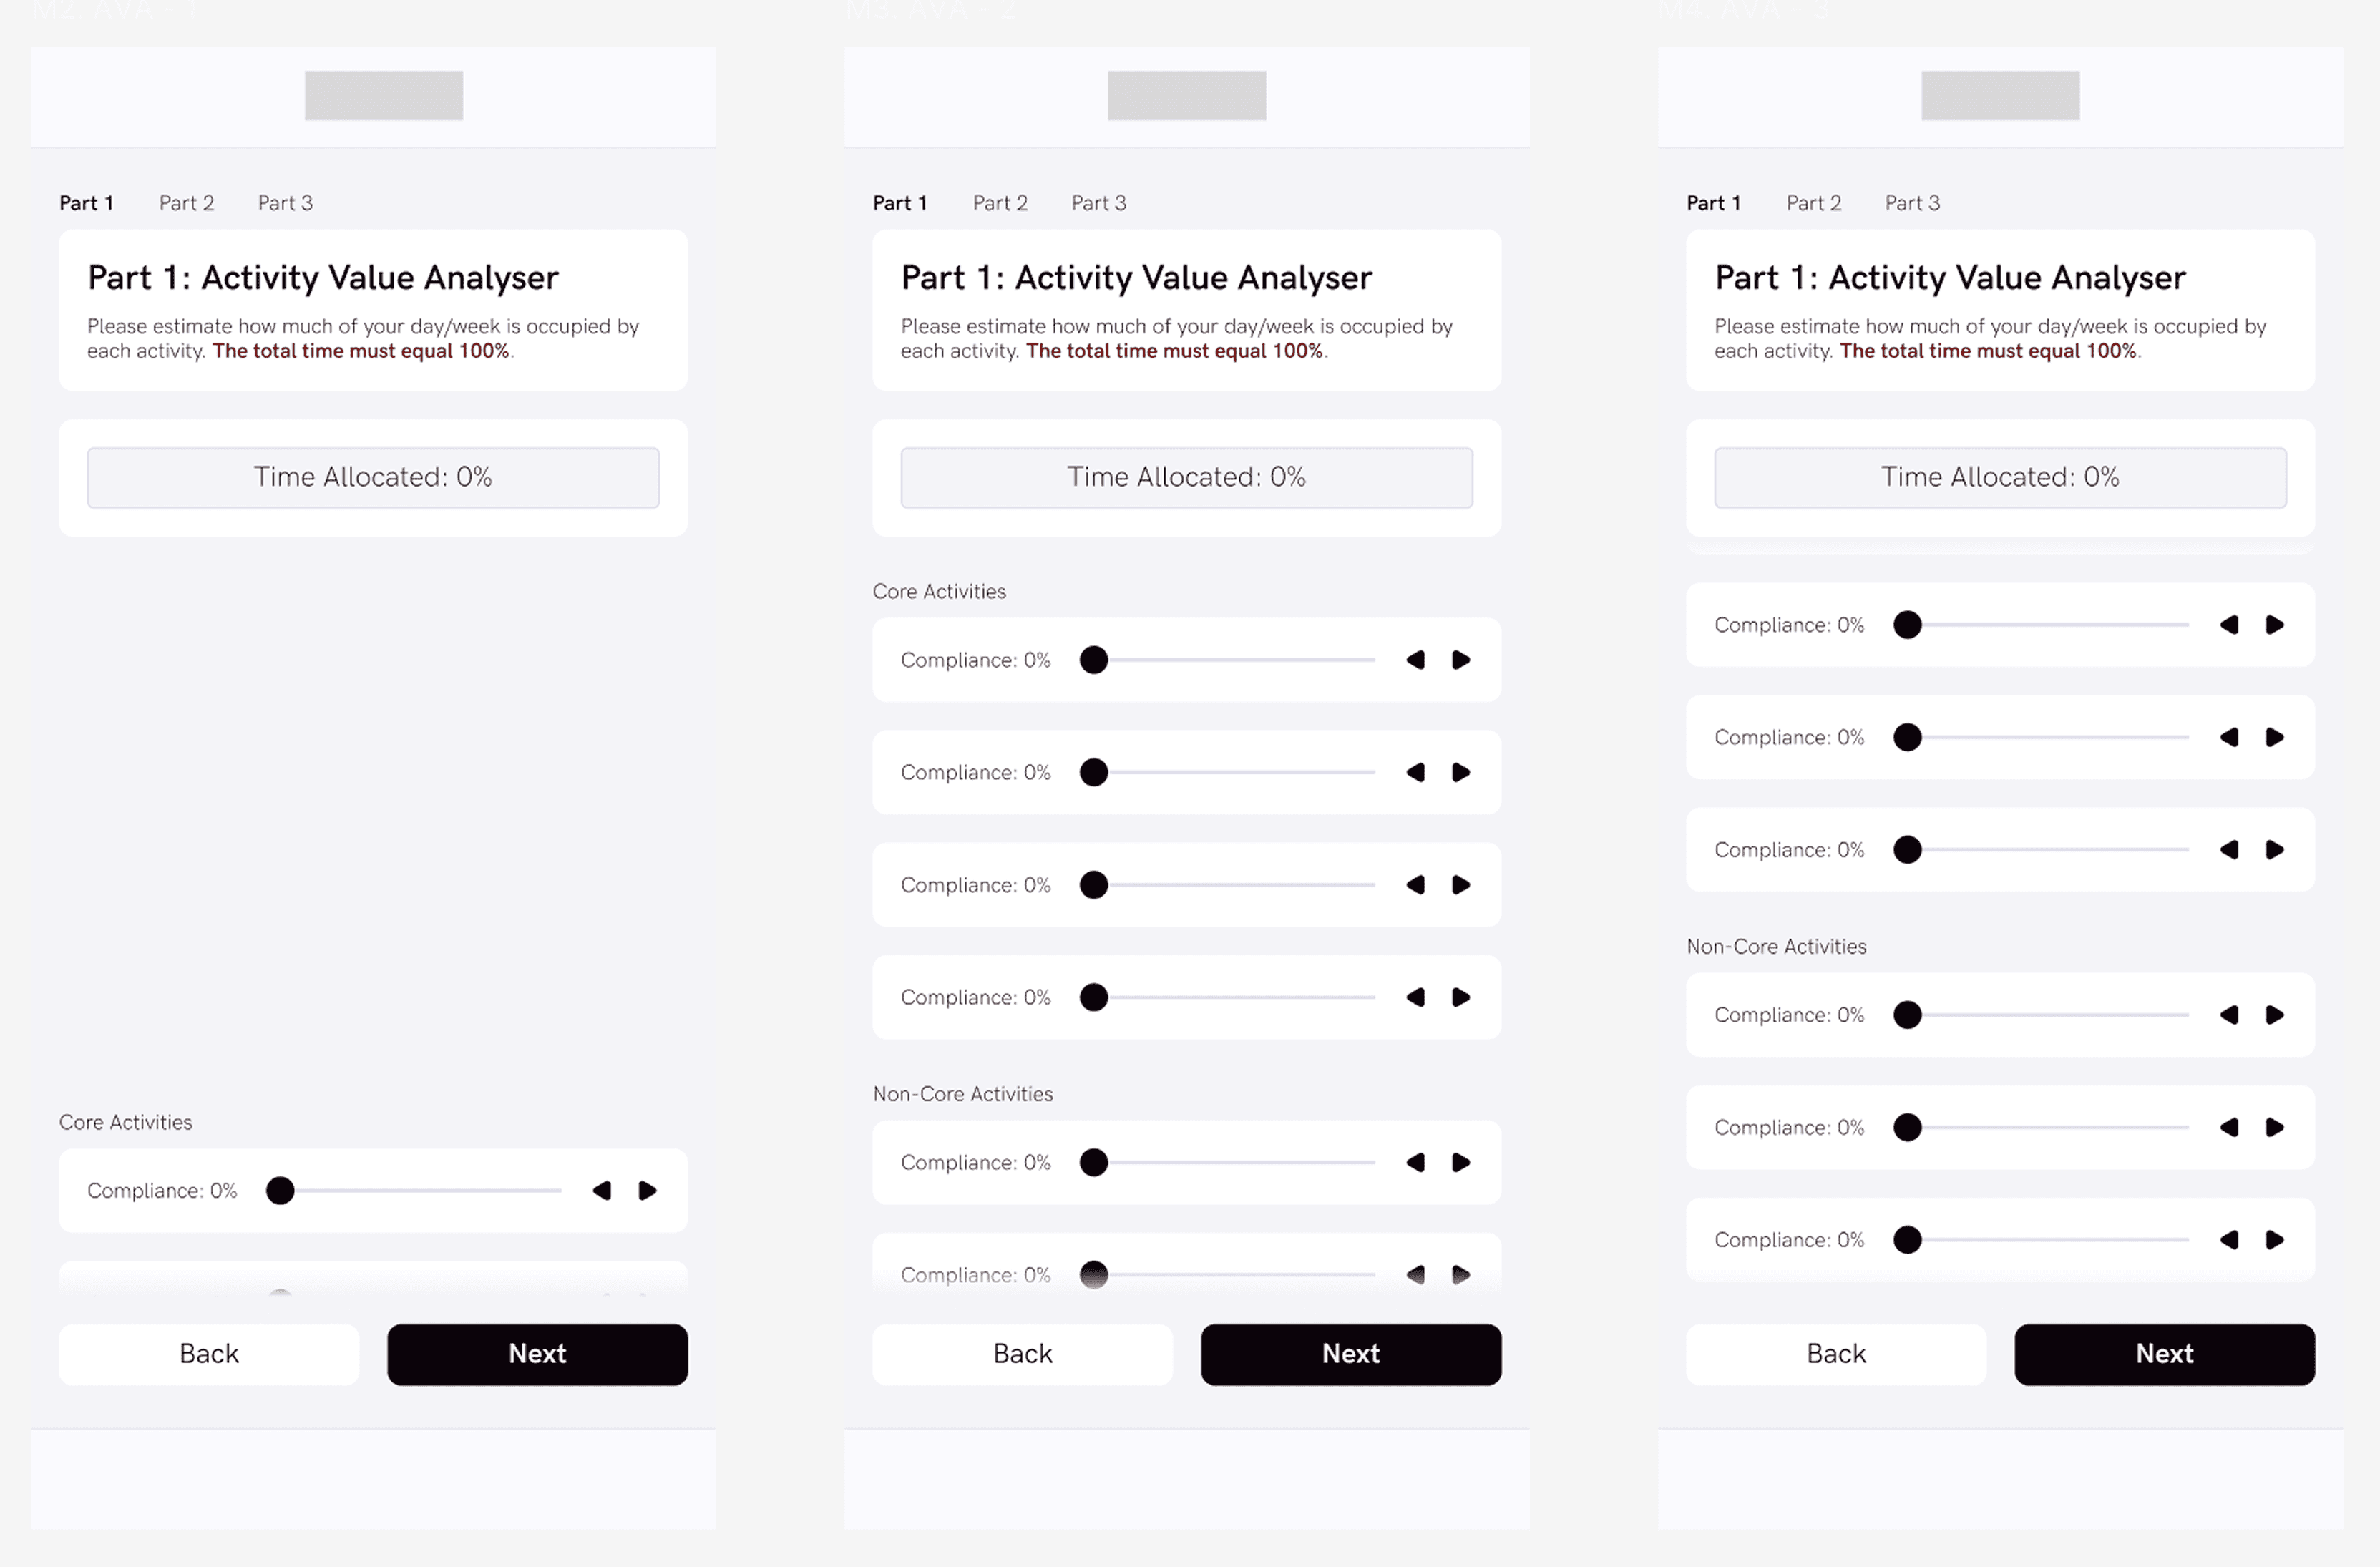
06 PROTOTYPING & TESTING
We developed a mid-fidelity Figma prototype to translate our insights into a realistic daily flow for consulting teams using the internal PwC tool. Our key innovative features included:
Opportunity Tracker: A centralised dashboard for consultants to log and monitor client opportunities, helping teams stay aligned on business development goals and reducing duplication of effort. Many teams were using siloed spreadsheets or disconnected tools, leading to duplicate pursuits and missed follow-ups.
Smart Recommendations: Based on entered data and activity patterns, the tool surfaced tailored recommendations such as relevant service lines, internal experts to collaborate with, or similar past projects, supporting more strategic decision-making. This directly supported PwC’s cross-functional delivery model and helped teams identify the best internal resources quickly.
Streamlined Reporting: Auto-generated summaries and visualisations of pipeline progress and engagement metrics, reducing the time spent compiling manual reports for leadership or partners.This allowed senior stakeholders to access real-time insights without chasing updates.
These features directly addressed pain points uncovered during user interviews, such as fragmented communication, lack of visibility, and manual admin, and ensured the tool fit naturally into daily routines while driving internal growth.